- Home
- Monitoring
- Logs/Graphs
Monitoring Logs/Graphs
Logs Overview
Monitoring logs are helpful for tracking the performance and availability of your website or web service over time. They provide a detailed record of when your site was up or down, response times, and other vital information. Analyzing these logs allows you to identify patterns, troubleshoot issues, and optimize the performance of your website or web service.
Graphs Overview
Graphs offer a visual representation of the monitoring data collected from your website or web service. They help you quickly identify trends, spot potential issues, and evaluate the overall performance of your site. By displaying data in an easily digestible format, graphs enable you to make informed decisions about how to improve your website or web service's performance and reliability.
Data Retention
We retain your monitoring logs indefinitely. This long-term data retention is beneficial because it allows you to analyze the performance of your website or web service over extended periods. By comparing historical data, you can identify long-term trends, assess the impact of changes made to your site, and make more informed decisions about future optimizations.
Accessing Logs and Graphs
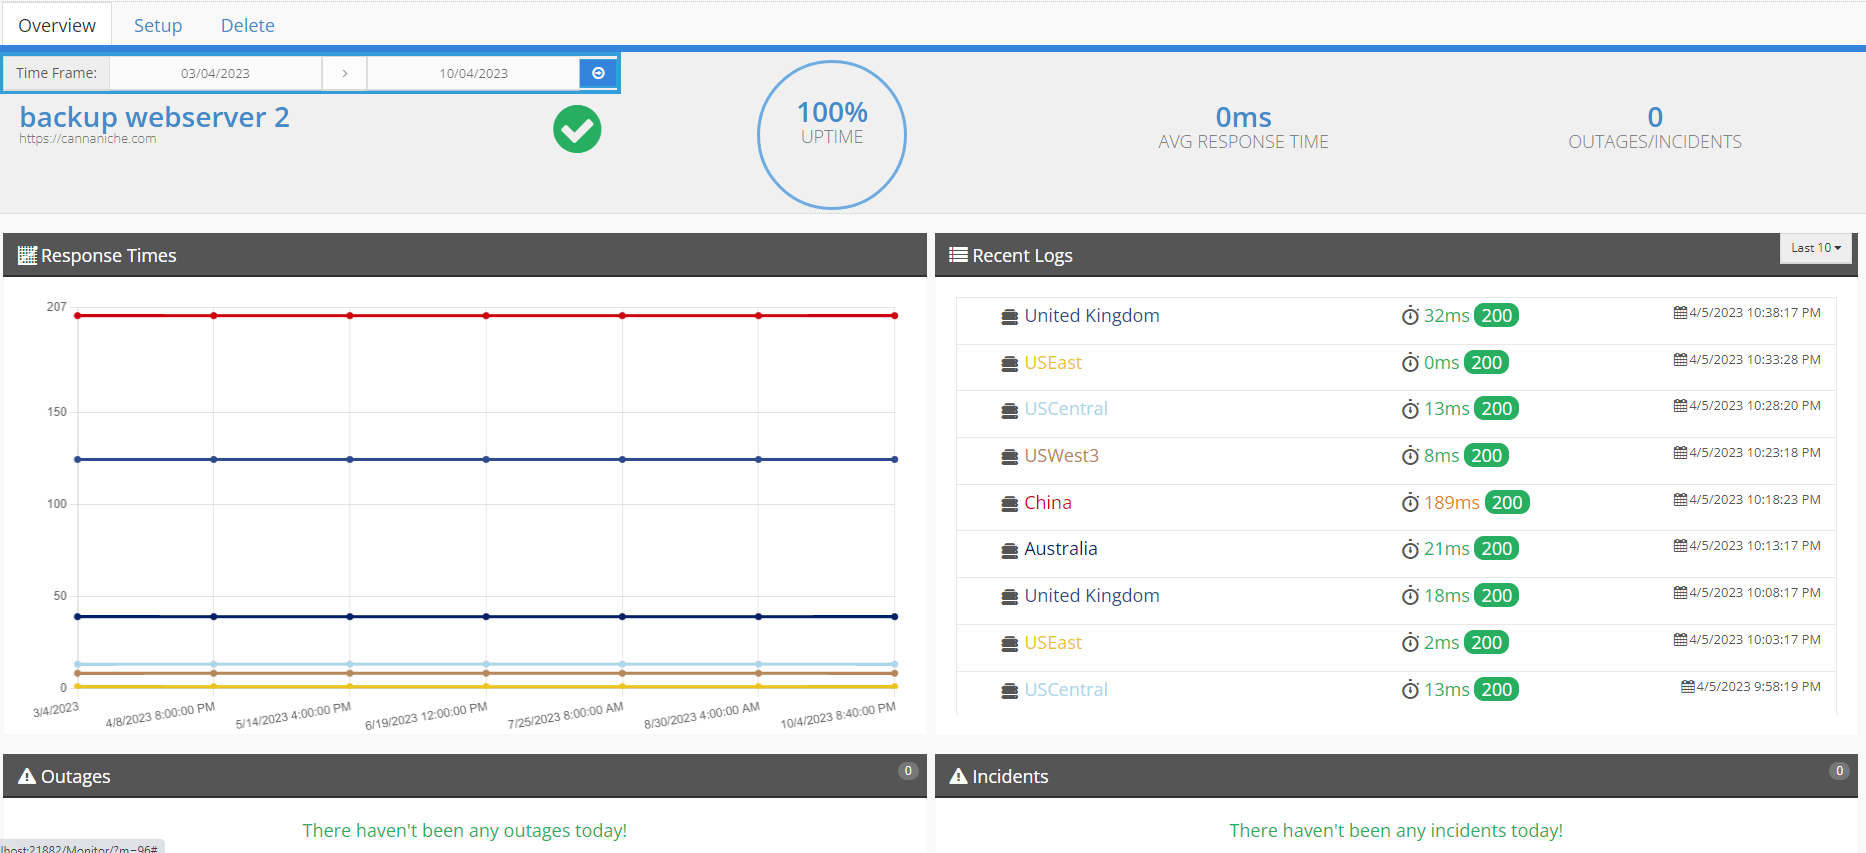
To access your logs and graphs, go to the Monitors page and select your desired monitor. You will be taken to the Overview tab, which displays a graph, recent logs, outages, and incidents. This tab defaults to showing data from the past 24 hours, but you can change the date range at the top to view data for different periods. Click the blue right arrow to reload the page and update the graph and logs based on the new date range.
The Overview tab also displays the overall uptime percentage, average response time, and the number of outages and incidents for the selected date range at the top of the page.
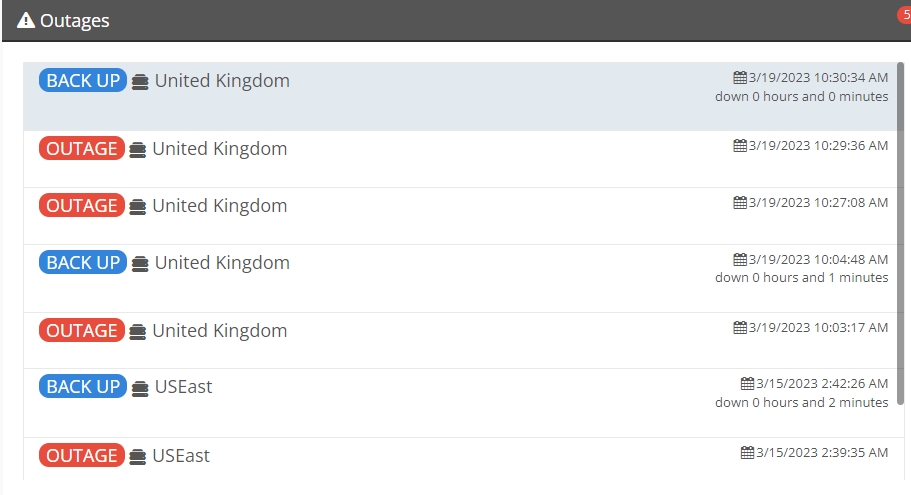
Outages and Incidents
The Outages section provides details about any downtime events, including when the issue occurred, the reason for the outage, when the service was restored, and the duration of the downtime. This information is crucial for understanding the causes of downtime and taking appropriate action to prevent future occurrences.
The Incidents section lists incidents that occurred during the selected date range. Incidents are manually initiated and can provide additional context about events affecting your website or web service. For more information on managing incidents, please refer to the Incident Management documentation.